The fall in household savings has been at the heart of recent debates in India. The decline in household savings is brought about by a drastic reduction in net financial savings as the household net financial savings to GDP ratio attained a four-decade low. Figure 1 shows the broad trend in household savings, physical savings and gold, and net financial savings.
The sharp reduction in household net financial savings in 2022-23 has been associated with an overall fall in household savings despite marginal recovery in physical savings.

Interpreting lower financial savings
The net financial savings of the household is the difference between its gross financial savings and borrowing. The gross financial savings of a household is the extent to which its financial assets change during a period. The financial assets of households typically comprise bank deposits, currency and financial investments in mutual funds, pension funds, etc. Though household borrowing includes credit from non-bank financial corporations and housing corporations, the bulk of the borrowing comprises credit from commercial banks. In general, there are at least three distinct factors that can potentially bring about a reduction in household net financial savings.
First, households typically finance their additional consumption expenditure by increasing their borrowing or depleting their gross financial savings. By financing higher consumption expenditure at any given level of disposable income, lower net financial savings provide stimulus for aggregate demand and output in this case.
Also read: No small change: on the raising of returns on small savings schemes
Secondly, when households finance higher tangible (physical) investment by increasing their borrowing or depleting their gross financial savings. The reduction in net financial savings in this case stimulates aggregate demand and output through the investment channel.
Third, when interest payment of a household increases say due to higher interest rates, households can meet the increased burden through borrowing or through depleting gross financial savings thereby inducing a reduction in net financial savings.
The first factor hardly played any role in the sharp reduction in gross financial savings in 2022-23 as the consumption to GDP ratio remained largely unchanged between 2021-22 (60.95%) and 2022-23 (60.93%). The second factor played only a limited role. While the gross financial savings to GDP ratio declined by 3 percentage points (7.3% to 5.3%) in 2022-23, household physical investment to GDP ratio increased only by 0.3 percentage point (12.6% to 12.9%) during the same period. Though higher borrowing is partly financed by interest income from financial assets, it can be largely attributed to higher interest payments of the household in the recent period.

Figure 2 reflects this phenomenon by depicting the trend in household borrowing to income ratio, debt to income ratio and the ratio between household physical savings and gross financial savings.
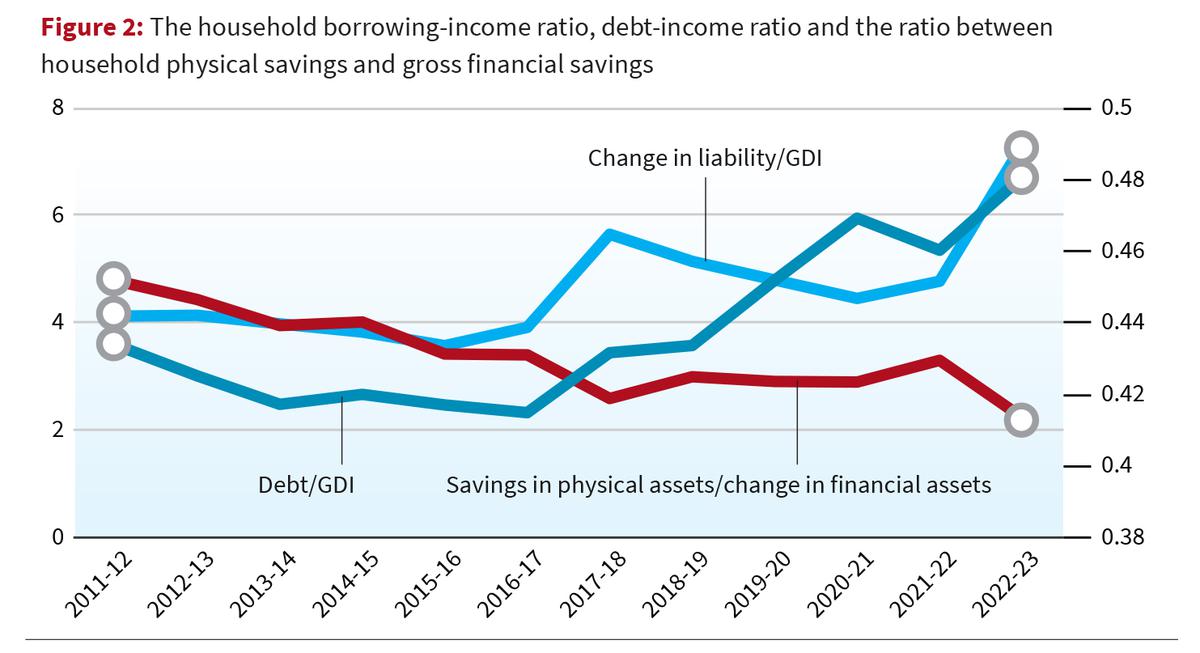
The share of household borrowing in household (disposable) income registered a sharp spike in 2022-23. Such a rise in household liabilities was associated with a decline in the physical savings to financial savings ratio, indicating a change in household asset composition in favour of financial assets.
Implication of higher debt burden
The rise in household debt burden has two concerns for the macroeconomy.
The first concern is about debt repayment and financial fragility. Since the repayment capacity depends on the income flow, a key criterion for evaluating a household’s debt sustainability is the difference between interest rate and the income growth rate. On the flip side, the interest payments from the households are the interest income of the financial sector. If households fail to meet their debt repayment commitments, then it reduces the income of the financial sector and deteriorates their balance sheets, which in turn can have a cascading effect on the macroeconomy if the latter responds by reducing their credit disbursement to the non-financial sector.
Figure 3 shows the difference between the weighted average lending rate of scheduled commercial banks and the growth rate of gross national income.
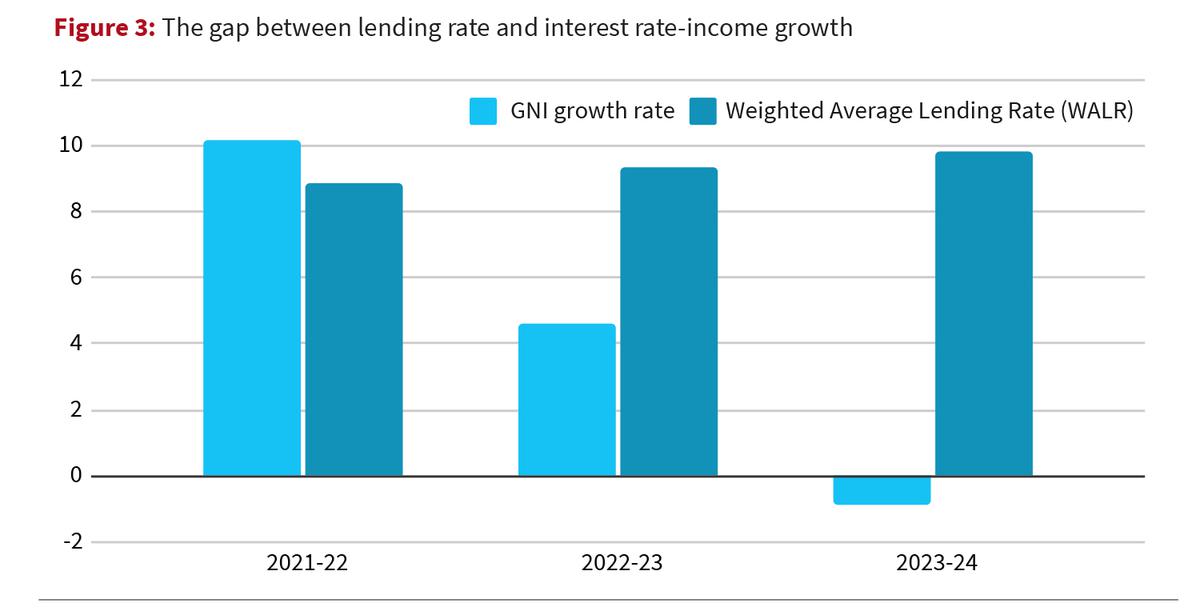
Though the difference shows a declining trend since 2021-22, the indicator turned out to be negative in the 2023-24 period. The sharp reduction in interest rate and income growth gap is on account of lower income growth rate and higher lending rate of the commercial banks. The weighted average lending rate registered a sharp rise in the last two years, particularly due to the tight monetary policy stance of the RBI and the sharp rise in the call money rate during this period.
The second concern pertains to the implication on consumption demand. Over and above disposable income, the consumption expenditure of the household can be affected by their wealth, debt, and interest rate. Reduction in household wealth can lead to lower consumption expenditure as households may attempt to preserve their wealth position by increasing their savings.
Higher household debt can also reduce consumption expenditure in at least two ways. First, if higher household leverage is perceived as an indicator of higher default risk, then it may induce banks to indulge in credit rationing and reduce the credit disbursement. The consequent reduction in credit disbursement can adversely affect consumption. Second, higher debt can reduce consumption expenditure by increasing the interest burden, not to mention the effect of higher interest rates on consumption expenditure.
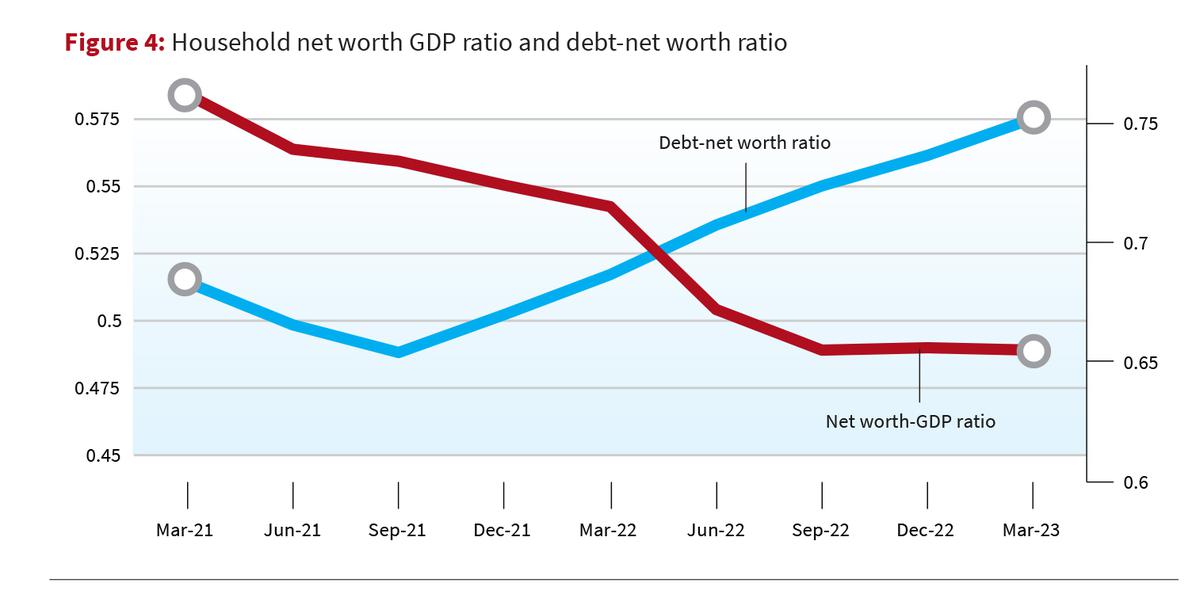
The Indian economy registered all these trends in the recent period. The financial wealth or the net worth of the household is the difference between the stock of financial assets and liabilities. As evident from figure 4, the financial wealth to GDP ratio of the household has registered a sharp decline in the recent period, along with a rise in leverage of the household as indicated by the rise in debt to net worth ratio.
Not surprisingly, the growth rate in private final consumption expenditure during 2023-24 registered a sharp decline as compared to 2022-23.
Macroeconomic implication
The implications of the procyclical leverage by the households along with the compositional change in the asset side of the balance sheet, albeit with a fall in the level of savings, for the stability of economic growth is concerning.
First, given that both the flow indicator of liabilities to disposable income and the stock indicator of debt to net worth shows an increasing trend makes the households vulnerable.
Second, the policy mantra of higher interest rate to counter inflation by reducing macroeconomic output and employment can leave households with an increasing level of debt in their balance sheets and potentially push the households into a debt trap. Third, the implications of high interest rate on debt burden can have an adverse impact on the consumption of the households and consequently for aggregate demand.
The household balance sheet trends indicate a broader change in the structure of the economy. The change in composition of the asset side of the household balance sheet towards financial assets indicate some degree of financialisation of the economy which moves from a production-based economy to a monetary or financial exchange-based economy making the five-trillion-dollar economy both jobless and fragile.
Zico Dasgupta and Srinivas Raghavendra teach economics at Azim Premji University.